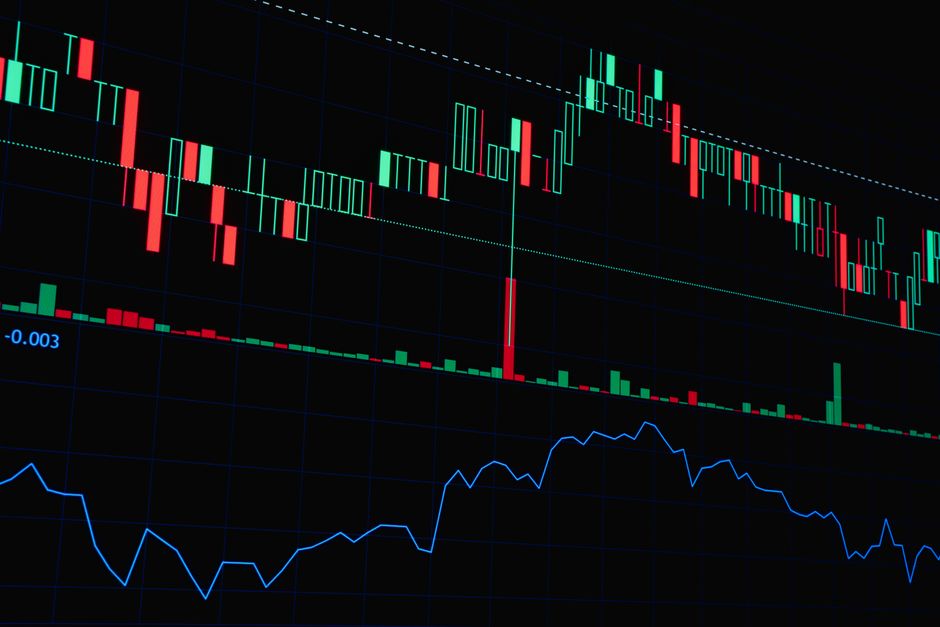
Many traders execute a breakout on a single ticker without checking the primary index or a highly correlated instrument. Data recorded at orb trading mistakes larrycrowne shows that this lack of correlation awareness leads to failed setups. An opening range breakout often fails when the broader market moves in the opposite direction. This error occurs when the intraday momentum of a specific stock fights the heavy weight of the S&P 500 or Nasdaq 100.
The Mechanics of Divergence
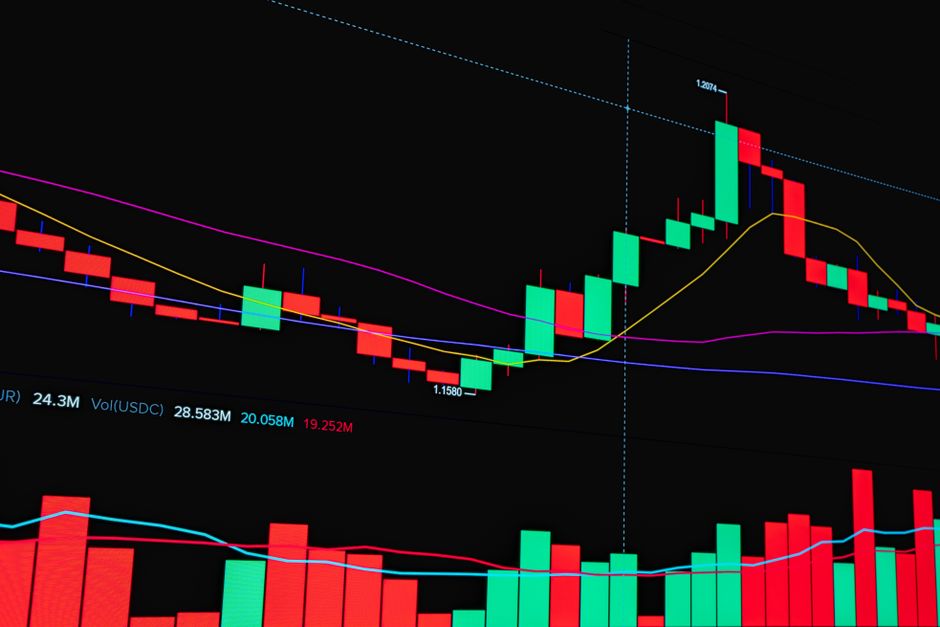
A trader sees a clean move above the five minute range and enters long. The ticker looks strong on its own merit. However, the index is printing lower lows during the same window. The index acts as a heavy anchor. The individual stock might attempt to move, but the lack of sector or index support causes the move to stall near the session high. The trade becomes a fight against the ocean rather than a ride on a wave. Success requires alignment between the specific instrument and the macro environment at the cash open.
Analyzing the Correlation Gap
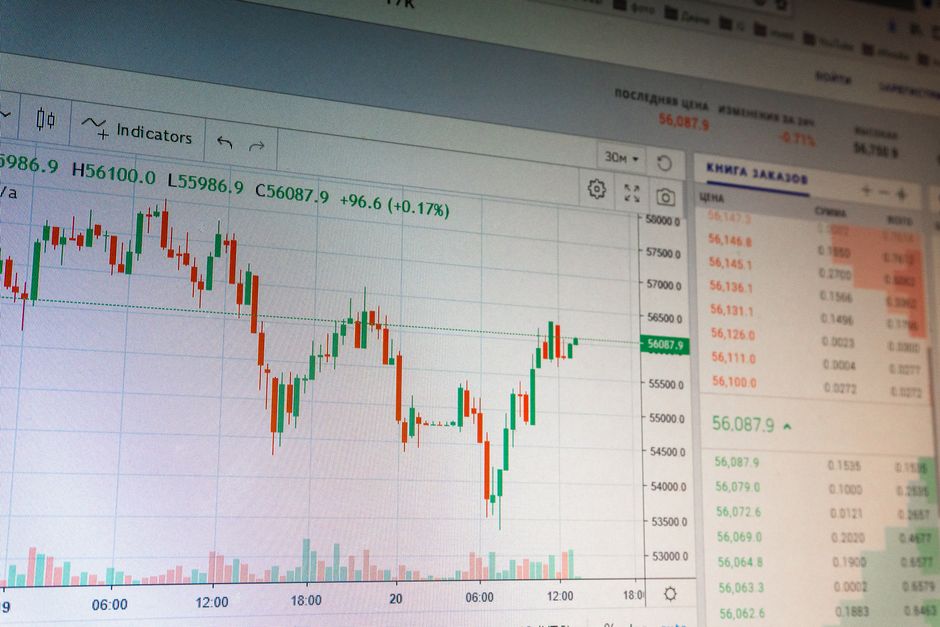
Heavy volume in a single stock does not negate a bearish index trend. If the 15 minute range of the SPY is trending down, a long position in a correlated tech stock carries increased risk. The mismatch creates a trap. One might see the stock break the opening range, but the underlying market pressure eventually forces the price back into the range. Monitoring the correlation during the first hour provides a filter for these false signals. A breakout without index confirmation lacks the mechanical support needed for high probability moves.
Timeframe Synchronization
The timeframe used to define the range must match the speed of the index. A 30 minute range provides a broader view, but the immediate pressure comes from the first fifteen minutes of trading. If the index is dumping, a breakout above a 5 minute level is often a liquidity trap. The index dictates the direction of the tide. The individual stock merely reacts to that tide. Checking the index trend at the market open prevents entering trades that are fighting the primary trend.
Execution Errors and Market Pressure
Entering a trade during the first hour requires looking at the bigger picture. If the 60 minute trend is clearly down, taking a long position on a minor breakout is a mechanical error. The pressure from the index will eventually overwhelm the local strength of the stock. A trader needs to see both the ticker and the index moving in unison. Without this synchronization, the probability of a stop out increases significantly. The work involves verifying that the sector and index support the specific breakout being taken.