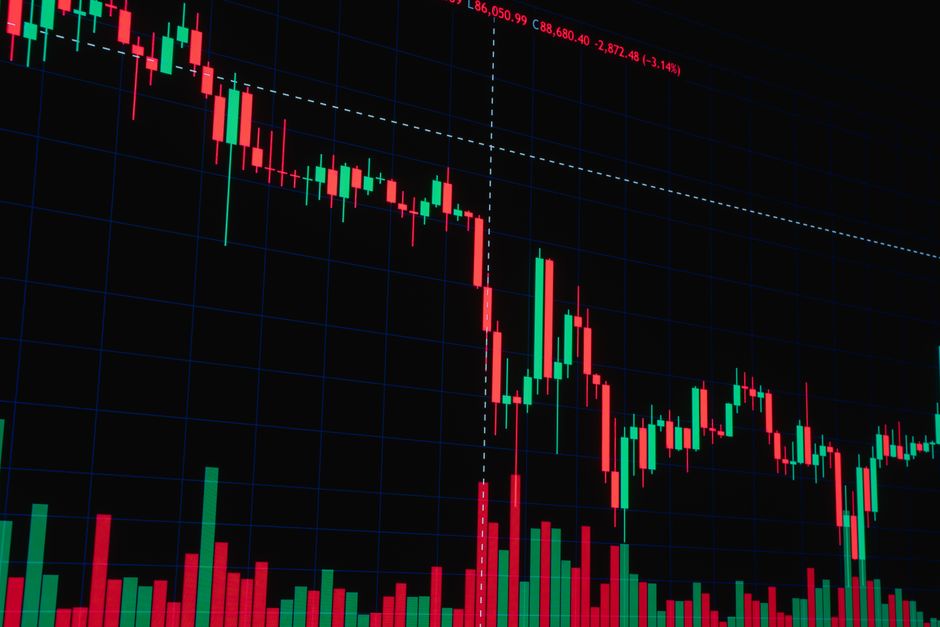
By the time the candle closes on the midpoint of the range, the entry has already been compromised. The logic found in the observations at orb trading mistakes larrycrowne differs from standard textbook theory because the focus remains on the mechanical failure of the opening range breakout. Trading requires seeing the specific rejection of the midpoint rather than guessing the direction of the intraday move.
The Mid-Range Trap Mechanics
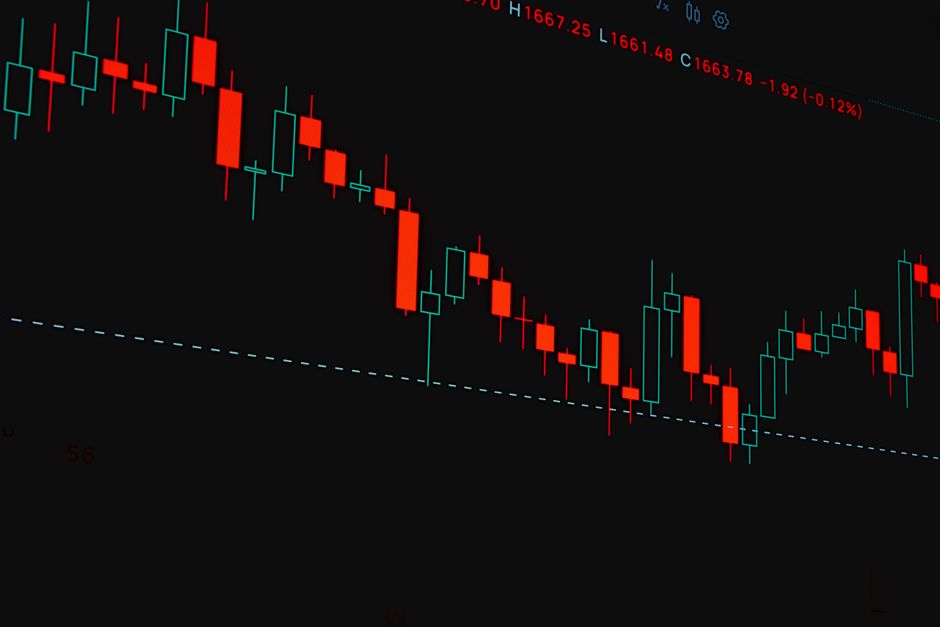
Entering a position exactly at the 50% mark of a five minute range creates a high probability of being stopped out by noise. The price often oscillates around this median level before the actual trend establishes itself. Many traders see the movement toward the center as a sign of strength, but it is often just a retest of the mean. This lack of direction leads to heavy slippage during the first fifteen minutes of the session. A trade placed here lacks a defined edge because the momentum shift has not occurred. The price is simply drifting between the session high and the low of the initial volatility.
Failure to Confirm Momentum
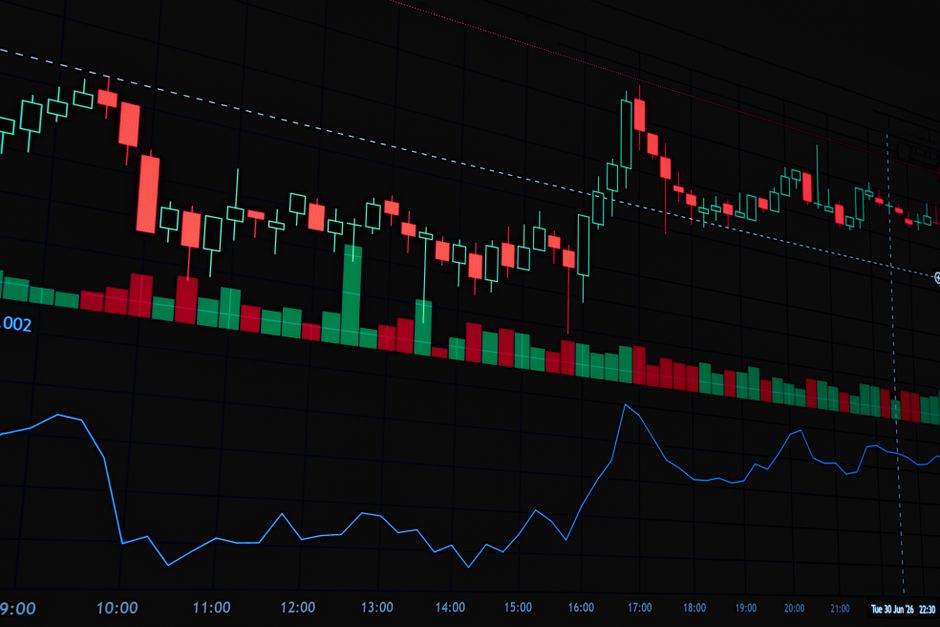
Directional bias must be earned through price action rather than assumed based on proximity to the center. A valid setup requires the price to clear the opening range and hold above the high or below the low. Entering at the halfway point ignores the fact that the market is still in a state of price discovery. The fifteen minute range often provides the necessary context that a mid-range entry misses. Without a clear break of the established boundaries, the position is merely a bet on volatility rather than a calculated move. The math does not support frequent entries at the median of a candle.
The Problem with False Breakouts
A common error involves misidentifying a minor retracement as a reversal. When the price touches the 50% level of the thirty minute range, it often triggers stop losses for those who entered too early. The market frequently seeks liquidity below the midpoint before expanding toward the actual direction of the day. This behavior is common during the first hour of regular trading hours. Mechanical execution requires waiting for the candle to close outside the established boundaries. Entering before the close results in catching falling knives or buying premature rallies.
Timeframe Misalignment
Using a 5 minute chart to execute a trade based on a 60 minute range leads to excessive noise. The smaller timeframe shows micro movements that do not reflect the true intraday trend. A trader must align the execution with the broader structure. If the price is stuck in the middle of the opening bell volatility, there is no trade to take. Waiting for the price to define its path outside the initial bounds removes the guesswork. A mechanical approach favors the late entrant who waits for confirmation over the early entrant who guesses at the midpoint.