
A trader expects the midpoint to act as a hard floor. Often it functions as a magnet for more liquidity. The mechanical errors found at orb trading mistakes larrycrowne focus on this specific failure in the opening range. Relying on the 50% level of a five minute range without observing candle structure leads to premature entries. The market open frequently produces volatility that slices through the center of the range before any real trend establishes itself.
The Illusion of the Equilibrium Level
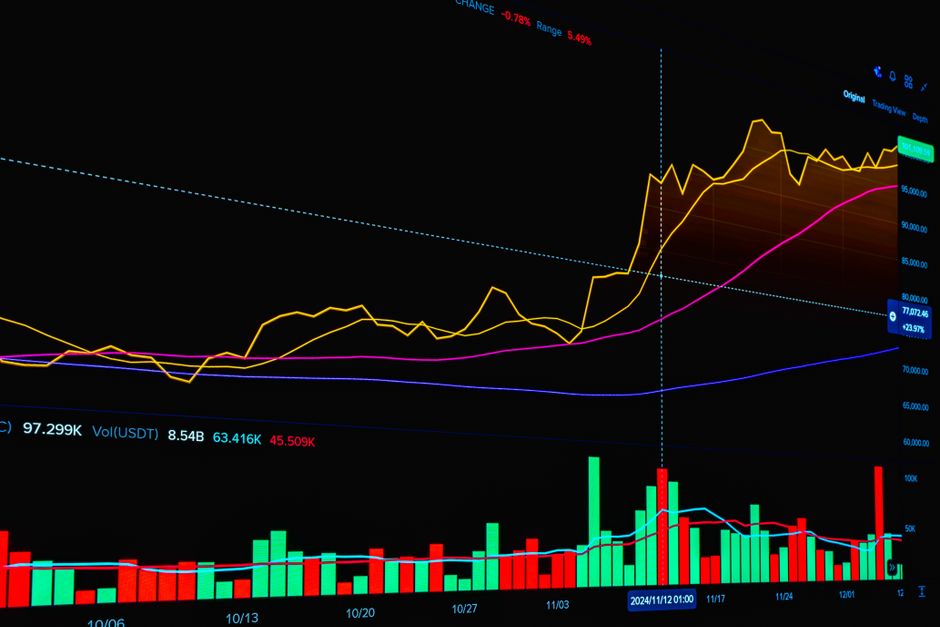
The midpoint represents a mathematical average, not a psychological wall. Placing limit orders exactly at the 50% mark of a thirty minute range ignores the reality of slippage and stop hunting. Price often penetrates the midpoint to seek the session high or the session low before continuing. A mechanical approach requires seeing a rejection candle or a shift in volume at that level. Entering solely because the price touched the middle of the opening range breakout is a recipe for getting caught in a chop zone. The midpoint is a coordinate, not a signal.
Contextual Failure at the Cash Open

The first fifteen minutes of regular trading hours provide the boundaries for the day. Traders often look at the 15 minute range and assume the center is a pivot. This assumption fails when the intraday trend is aggressive. In a strong trending environment, the price will rarely touch the midpoint of the opening range. Waiting for a touch that never comes results in missed trades. Conversely, in a mean reverting market, the price may dance around the midpoint, triggering stops on both sides. A specific timeframe must be selected to define the range, but the midpoint alone lacks the strength to dictate direction.
Price Action vs. Mathematical Averages
Mechanical execution requires price action confirmation. This means observing how a candle closes relative to the midpoint. If a 5 minute candle closes deep into the upper half of the range, the midpoint is no longer a resistance level. It has become a support level. Trading the level without looking at the candle bodies results in being caught on the wrong side of a breakout. The opening bell sets the stage, but the subsequent candles dictate the validity of the levels. A level without a candle structure is just a number on a screen.
Managing the Midpoint Trap
Avoid placing orders at the exact mathematical center. Instead, look for the area slightly above or below the 50% mark where volume actually congregates. The thirty minute range provides a broader view, but the micro movements within the first hour are where the errors occur. A successful execution relies on the relationship between the range boundary and the midpoint. If the price approaches the midpoint with high momentum, the midpoint will likely fail. Waiting for a slowdown or a reversal pattern at that specific coordinate separates a mechanical process from a guess.