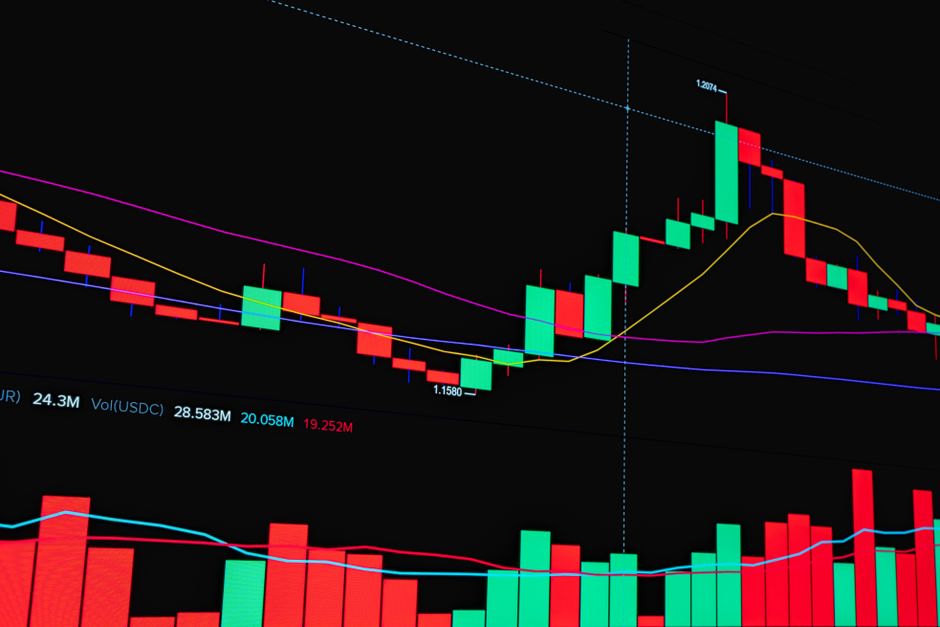
As the opening bell rings and the price pierces the initial boundary, the trap is set, as the notes at orb trading mistakes larrycrowne describe. This specific failure in an opening range breakout often leads to a total loss of direction. Most traders see a breach of the high and assume a trend is forming. Instead, the price lacks the volume to sustain the move. This mistake happens during the first fifteen minutes of regular trading hours. The price moves above the session high only to stall and snap back into the center of the range. This is not a trend. It is a liquidity grab.
The Mechanics of the Trap
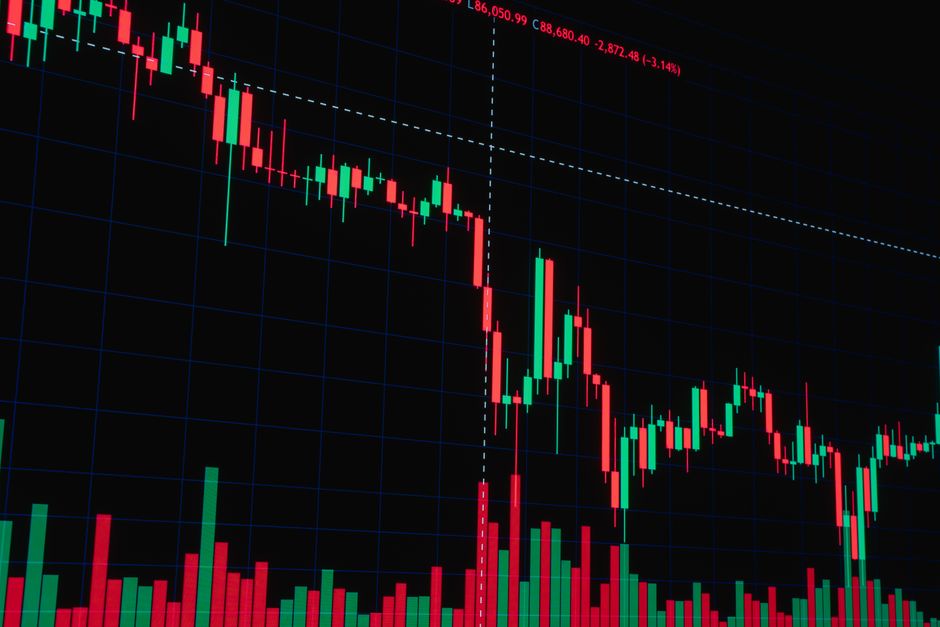
A failed breakout occurs when the price moves outside the five minute range but cannot find buyers to hold the new level. The order flow shows heavy selling pressure at the new high. This creates a divergence between price action and volume. Instead of a continuation, the market sees a rapid return to the mean. The candle closes back inside the previous structure. This signal indicates that the breakout attempt was false. The direction of the trade shifts from long to short almost immediately. This reversal targets the opposite side of the established range.
Identifying the Reversal Signal
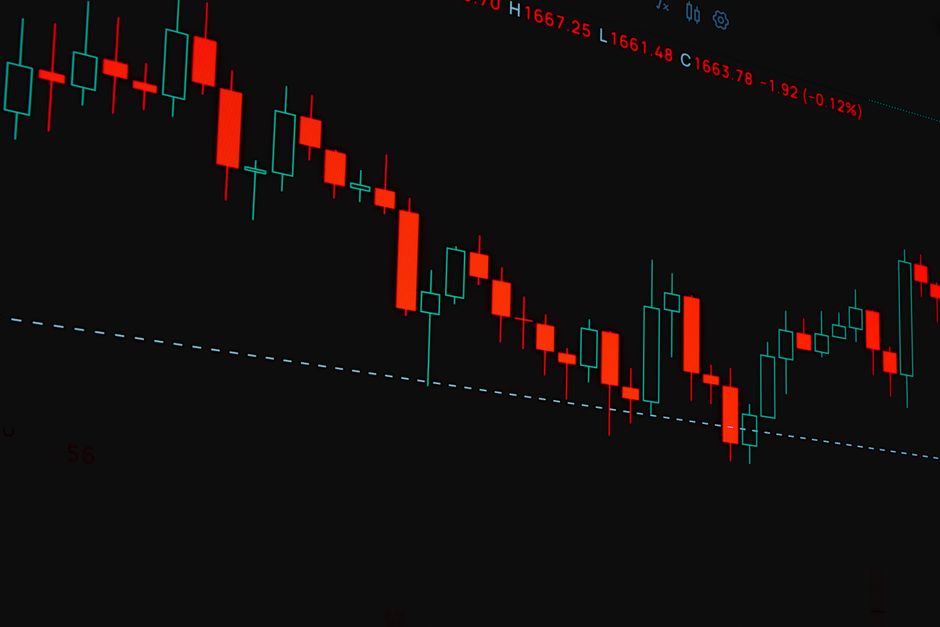
A valid reversal signal appears when the price fails to hold the levels established during the first hour. The failure to maintain a position above the opening range creates a vacuum. Traders look for a heavy candle that closes back within the boundaries. This move often happens quickly after the cash open. The velocity of the move back into the range is a primary indicator of strength. High volume on the return trip confirms that the breakout was a trap. This momentum usually carries the price through the midpoint of the range.
Timeframe and Structure
The timeframe used to identify the trap dictates the depth of the mean reversion. A failure on a 5 minute chart might only result in a small retracement. However, a failure on the 15 minute range often leads to a full sweep of the session low. The structure of the market during the first hour provides the boundaries for these moves. If the price cannot sustain a move above the opening range, the bias remains neutral or bearish. The session high becomes a point of resistance rather than a launchpad.
Managing the Mean Reversion
The trade targets the midpoint or the opposing boundary of the range. A position is entered only after the price closes back inside the range. Stop losses are placed just above the recent failed high. The risk to reward ratio improves when the failure occurs early in the session. Waiting for the 30 minute range to stabilize provides more certainty. The movement back to the mean is a mechanical response to the lack of follow through. Success depends on recognizing the failure as it happens, not after the damage is done.